
Lighthouseでコンソールのエラーを指摘されたときの直し方
Lighthouse のベストプラクティスで「Browser errors were logged to the console」(日本語の表示では「ブラウザのエラーがコンソールに記録されました」)と出たら、表に並んだエラーを1件ずつ、出どころから直します。1件でも残っていると不合格のままです。ページを開いたときに DevTools のコンソールが赤いエラーで埋まる、画像やスクリプトが 404 になっている、といった場面で指摘される項目です。
検証用のページには、置いていないファイルの読み込み、ファビコンの指定漏れ、存在しない要素への操作、API の 404 を入れ、合わせて6件のエラーが出るようにしました。直すたびに Lighthouse を実行し、表から消えるものと残るものを確かめています。
検証環境は Ubuntu 24.04、Node.js 22、Lighthouse 13.6.0(npm のパッケージ)です。Lighthouse はコマンドラインから既定の設定(モバイル)で、ベストプラクティスのカテゴリーだけを実行しました。Chrome は Playwright 1.63.0 に入っている Chrome for Testing 153 を使いました。サーバーは Node.js の http モジュールで書いた小さなものを、同じマシンの localhost で動かしました。DevTools の Lighthouse パネル、PageSpeed Insights、広告や計測サービスなど他社のスクリプトが出すエラー、React などのフレームワークを使ったページは試していません。
この検証で表に出たのは、ネットワークのエラー・例外・console.error
検証用のページは、HTML と JavaScript(app.js)だけの小さなものです。HTML では、置いていないスクリプト(/js/analytics.js)と画像(/img/banner.png)を読み込ませています。app.js は次のとおりです。
// お知らせを読み込む(失敗したら console.error に出す)
fetch('/api/news.json')
  .then((res) => {
    if (!res.ok) throw new Error(`お知らせの取得に失敗しました: ${res.status}`);
    return res.json();
  })
  .then((items) => {
    document.querySelector('#news').textContent = items[0].title;
  })
  .catch((err) => console.error(err));

// 購読ボタンにイベントを付ける(ボタンがないページでは例外になる)
document.querySelector('#subscribe').addEventListener('click', () => {
  alert('購読しました');
});
/api/news.json もサーバーに置いておらず、HTML には #subscribe のボタンがありません。このページで Lighthouse を実行し、結果の JSON からこの項目(errors-in-console)の結果を小さなスクリプト(summarize.mjs)で抜き出しました。
$ npx lighthouse http://localhost:8090/ --only-categories=best-practices --output=json --output=html --output-path=./out/broken --chrome-flags="--headless=new --no-sandbox" --quiet
exit: 0
$ node summarize.mjs out/broken.report.json
lighthouseVersion: 13.6.0  formFactor: mobile  locale: en-US
best-practices score: 96
errors-in-console: score=0 title="Browser errors were logged to the console"
  item: source=console.error location=/app.js:10 description="Error: お知らせの取得に失敗しました: 404\n    at http://localhost:8090/app.js:4:24"
  item: source=network location=/img/banner.png:1 description="Failed to load resource: the server responded with a status of 404 (Not Found)"
  item: source=network location=/js/analytics.js:1 description="Failed to load resource: the server responded with a status of 404 (Not Found)"
  item: source=network location=/api/news.json:1 description="Failed to load resource: the server responded with a status of 404 (Not Found)"
  item: source=network location=/favicon.ico:1 description="Failed to load resource: the server responded with a status of 404 (Not Found)"
  item: source=exception location=/app.js:13 description="TypeError: Cannot read properties of null (reading 'addEventListener')\n    at http://localhost:8090/app.js:13:37"
  weight in best-practices: 1
HTML のレポートでは、赤い三角のアイコンが付いた項目として出ます。開くと、エラーが出た場所(Source)と内容(Description)の表が並びます。
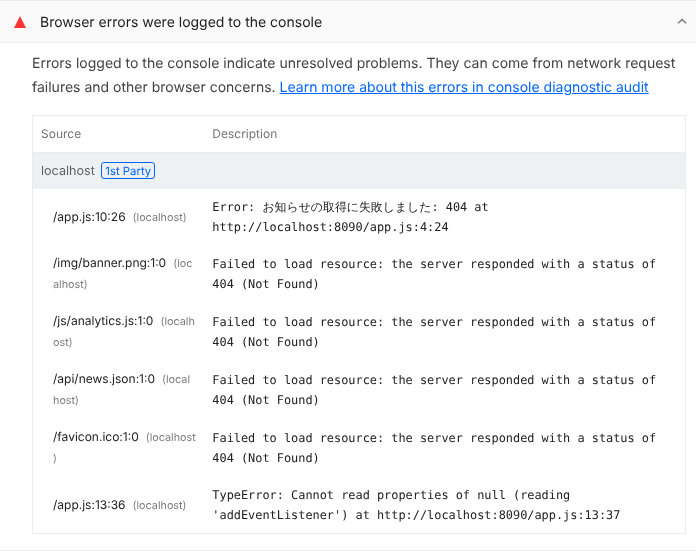
結果の JSON の source の値で、エラーの出どころが分かります(HTML のレポートの表には出ません)。この検証で出た値は次の3つです。
source |
何が起きたか | この検証での例 |
|---|---|---|
network |
ファイルや API の取得が失敗した | 404 になった4件 |
exception |
JavaScript の例外が、どこでも捕まえられずに残った | null に addEventListener を呼んだ |
console.error |
コードが console.error を呼んだ |
fetch の失敗を catch で出した |
Lighthouse 13.6.0 のコードでは、DevTools のコンソールに出るメッセージのうち、レベルが error のものを数えています(既定で外すのは ERR_BLOCKED_BY_CLIENT.Inspector を含むメッセージだけ)。合否は、残った件数が0件かどうかだけで決まります。公式の解説にも、コンソールに出たブラウザのエラーはすべて指摘する、と書かれています。
ベストプラクティスの点数への重みは1です(13.6.0 の設定。同じカテゴリーの deprecations は5)。この検証では、6件あっても1件だけでも点数は 96 で、0件にしたときに 100 になりました。
favicon.ico の 404 は、HTML に書いていないファイルです。HTML にファビコンの指定がないと、Chrome は /favicon.ico を取りに行きました。サーバーのアクセスの記録にも、Lighthouse を実行するたびに GET /favicon.ico の 404 が残っていました。
404のファイルは、置くか、HTMLの参照を直す
network のエラーは、表の Source に出た URL がそのまま手がかりになります。ファイルを置き忘れたのか、HTML に書いたパスが間違っているのかを確かめて、どちらかを直します。
検証では、/js/analytics.js と /img/banner.png を置きました。ファビコンは SVG のファイルを置き、HTML の <head> で指定しました。
<link rel="icon" href="/favicon.svg" type="image/svg+xml">直した段階ごとに、別のポートでページを配っています。この状態で実行すると、表は次の3件になりました。
errors-in-console: score=0 title="Browser errors were logged to the console"
  item: source=console.error location=/app.js:10 description="Error: お知らせの取得に失敗しました: 404\n    at http://localhost:8091/app.js:4:24"
  item: source=network location=/api/news.json:1 description="Failed to load resource: the server responded with a status of 404 (Not Found)"
  item: source=exception location=/app.js:13 description="TypeError: Cannot read properties of null (reading 'addEventListener')\n    at http://localhost:8091/app.js:13:37"
アクセスの記録を見ると、Chrome は /favicon.ico の代わりに /favicon.svg を取りに来て、200 が返っていました。ファビコンを用意しないと、Chrome が取りに行く /favicon.ico の 404 がこの項目に数えられます。
例外は、要素がないときの書き方を直す
exception の行は、TypeError: Cannot read properties of null (reading 'addEventListener') でした。HTML に #subscribe のボタンがないので、document.querySelector('#subscribe') が null を返し、そこに addEventListener を呼んでいます。
ボタンがないページでは何もしないなら、オプショナルチェーン(?.)を使います。手前の値が null か undefined のときは、例外を投げずに undefined になります。
-document.querySelector('#subscribe').addEventListener('click', () => {
+document.querySelector('#subscribe')?.addEventListener('click', () => {
これで、表から exception の行が消えました。直す行は、レポートの表の Source に出た /app.js:13:36 や、メッセージの最後に付いた app.js:13:37 で分かります。
console.warnに変えても、APIの404は残る
残りの2件は、どちらも /api/news.json が 404 だったことが原因です。fetch が失敗した記録(network)と、それを受けてコードが出した console.error の2件が出ています。
試しに、console.error(err) を console.warn(err) に変えました。Lighthouse 13.6.0 のコードは警告(warning)を集めますが、この項目で数えるのはエラーだけです。結果は次のとおりで、console.error の行は消えましたが、network の行は残りました。
errors-in-console: score=0 title="Browser errors were logged to the console"
  item: source=network location=/api/news.json:1 description="Failed to load resource: the server responded with a status of 404 (Not Found)"
取得が失敗したことは、Chrome がコンソールに出しています。console.warn に変えても、この行は消えません。Playwright で同じページを開くと、お知らせの欄は「読み込み中…」のままで、ページとしても直っていません。
APIは「データなし」でもエラーにしない
検証のページでは、お知らせがないときは 404 ではなく、200 で空の配列([])を返すことにしました。JavaScript も、空のときの表示を足しています。console.error は、通信の失敗など本当のエラーのときのために残しました。
   .then((items) => {
-    document.querySelector('#news').textContent = items[0].title;
+    document.querySelector('#news').textContent = items.length ? items[0].title : 'お知らせはありません';
})$ node summarize.mjs out/step4.report.json
lighthouseVersion: 13.6.0 formFactor: mobile locale: en-US
best-practices score: 100
errors-in-console: score=1 title="No browser errors logged to the console"
weight in best-practices: 1項目は合格の表示(「No browser errors logged to the console」、日本語の表示では「コンソールに記録されたブラウザのエラーはありません」)になり、ベストプラクティスの点数は 100 になりました。Playwright で開いたときも、コンソールにエラーや警告は出ず、お知らせの欄には「お知らせはありません」と表示されました。
直せないエラーを外す設定は、エラーのメッセージの文言で判定する
Lighthouse 13.6.0 のこの項目には、ignoredPatterns という設定があります。表の Description(エラーのメッセージ)に、指定した文字列が含まれるか、正規表現が当てはまる行を数えなくなります。既定では ERR_BLOCKED_BY_CLIENT.Inspector だけが入っています。
直す前のページで、次の設定ファイルを --config-path=./ignore-config.mjs で渡して実行しました。
// errors-in-console に ignoredPatterns を渡す設定
export default {
  extends: 'lighthouse:default',
  settings: { onlyCategories: ['best-practices'] },
  audits: [
    {
      path: 'errors-in-console',
      options: { ignoredPatterns: ['favicon.ico', /Cannot read properties of null/] },
    },
  ],
};正規表現に当てはまった例外の行は消えましたが、favicon.ico の 404 は残りました。404 の行の Description は「Failed to load resource: …」だけで、URL を含まないためです。表の Source に出ている URL では外せません。
errors-in-console: score=0 title="Browser errors were logged to the console"
  item: source=console.error location=/app.js:10 description="Error: お知らせの取得に失敗しました: 404\n    at http://localhost:8090/app.js:4:24"
  item: source=network location=/img/banner.png:1 description="Failed to load resource: the server responded with a status of 404 (Not Found)"
  item: source=network location=/js/analytics.js:1 description="Failed to load resource: the server responded with a status of 404 (Not Found)"
  item: source=network location=/api/news.json:1 description="Failed to load resource: the server responded with a status of 404 (Not Found)"
  item: source=network location=/favicon.ico:1 description="Failed to load resource: the server responded with a status of 404 (Not Found)"
この検証では、コマンドラインの --config-path で設定ファイルを渡して試しました。外した行はレポートの表に出なくなるだけで、エラーが起きていること自体は変わりません。